Stock Market Outlook post Operation Sindoor: Indian stock markets are likely to exhibit high volatility in the near-term as rising tensions between India-Pakistan, following India’s retaliatory action to avenge the Pahalgam terror strike in Kashmir. In the wee hours of Wednesday, the Indian armed forces launched a series of strikes under ‘Operation Sindoor’ on terror infrastructure in Pakistan and Pakistan-occupied Kashmir (PoK). A total of nine sites were targeted by the Indian armed forces, with the Indian Army shortly announcing, “Justice is served.” Following which, GIFT Nifty May futures tumbled to a low of 24,227; but since then have recovered and quoted around 24,350 levels in morning deals. Here are the key levels to watch out for on the NSE Nifty 50 index and the BSE Sensex as market brace for likely impact of rising India-Pakistan tensions.
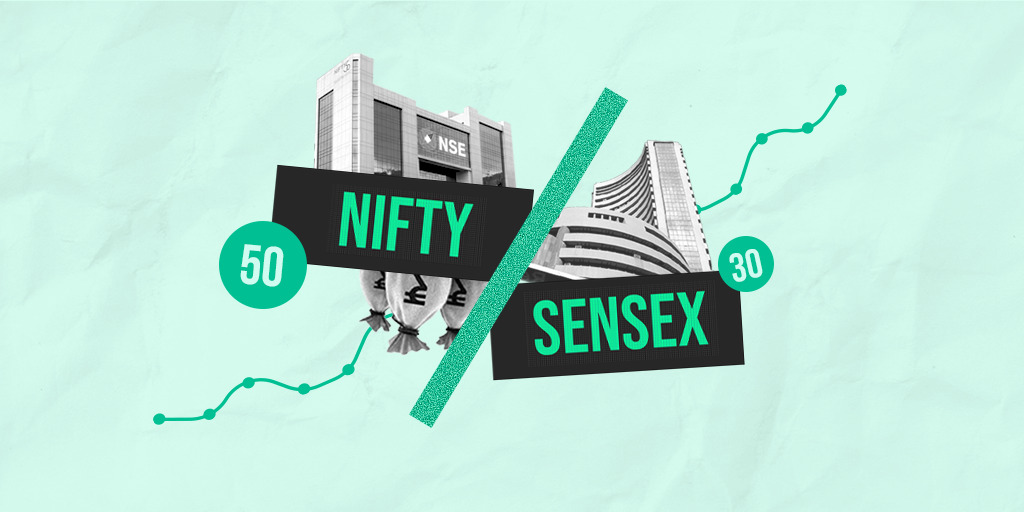
NSE Nifty Current Level: 24,380 Downside Risk: 6.4% Support: 24,200; 24,000; 23,700 Resistance: 24,350; 24,460; 24,589 Technical chart shows presence of near support for the Nifty at 24,200 levels; below which the index may seek support around its 200-day Simple Moving Average (200-DSMA), which stands at 24,050 levels. The overall bias for the Nifty is expected to remain favourable as long as the index holds above 23,700 levels, on a daily closing basis. Key momentum oscillators like the 14-day Relative Strength Index (RSI), the Moving Average Convergence-Divergence (MACD) and the Stochastic Slow were showing signs of tiring out, post the recent 13 per cent rally in the Nifty from a low of 21,744 on April 7. The recent rally saw the Nifty gain 2,845 points in absolute terms. As per the retracement theory, a 38.2 per cent retracement of the recent rally indicates that the Nifty can potentially fall to 23,500 levels. Similarly, 50 per cent and 61.8 per cent retracement of the rally suggests a likely downside target of 23,165 and 22,830 levels, respectively. For now, upside on the Nifty may be capped around its recent high at 24,589-odd levels, with near resistance likely around 24,350 and 24,460 levels.
BSE Sensex Current Level: 80,641 Downside Risk: 4.3% Support: 79,365; 78,070 Resistance: 80,900; 81,100; 82,000 The weekly Fibonacci chart suggests key support for the BSE Sensex at 79,365 levels. Break and sustained trade below the same can potentially accentuate the fall, and the Sensex could then slide to 78,070 and 77,150 levels in the short-term. On the upside, the 80,900 – 81,100 zone shall act as the near-term resistance zone; above which the major hurdle for the BSE Sensex stands around the 82,000-mark.
Top-notch SEBI registered research analyst
Best SEBI registered Intraday tips provider
Telegram | Facebook | Instagram
Call: +91 9624421555 / +91 9624461555