D‑Street Turns Cautious as US Trade‑Deal Deadline Looms on July 9

India’s equities market took a cautious turn this week as investors awaited clarity on a potential India‑US interim trade agreement before the July 9 tariff deadline. The uncertainty, coupled with tightening global conditions and recent regulatory actions, weighed on market sentiment.


Market Performance & Sentiment

  • Nifty ended the week at 25,461, while Sensex closed near 83,433, effectively snapping a two-week rally, with weekly losses of around 0.7%.
  • Sector movement stayed mixed—about 7 out of 13 sectors declined, with financials falling 1.75% over the week.
  • India VIX, the volatility index, held near a nine-month low (~12.3), indicating muted fear in the markets.

Key Drivers Behind the Caution

1. India‑US Trade Deal Uncertainty

  • The US has set a firm July 9 deadline, after which tariffs of up to 26% may be imposed on Indian imports.
  • While India is open to a deal, it remains firm on issues like agriculture and dairy, not rushing to meet deadlines purely under pressure.
  • Jefferies and other analysts stress that India’s competitiveness compared to China, Vietnam, and Bangladesh will shape the outcome.

2. Trump’s Threat of “Reciprocal” Tariffs

  • US President Trump has threatened tariffs ranging from 10% to 70% on nations without trade deals and begun issuing notices to trading partners.
  • Markets are pricing in the risk of such tariffs if India fails to finalize a deal in time.

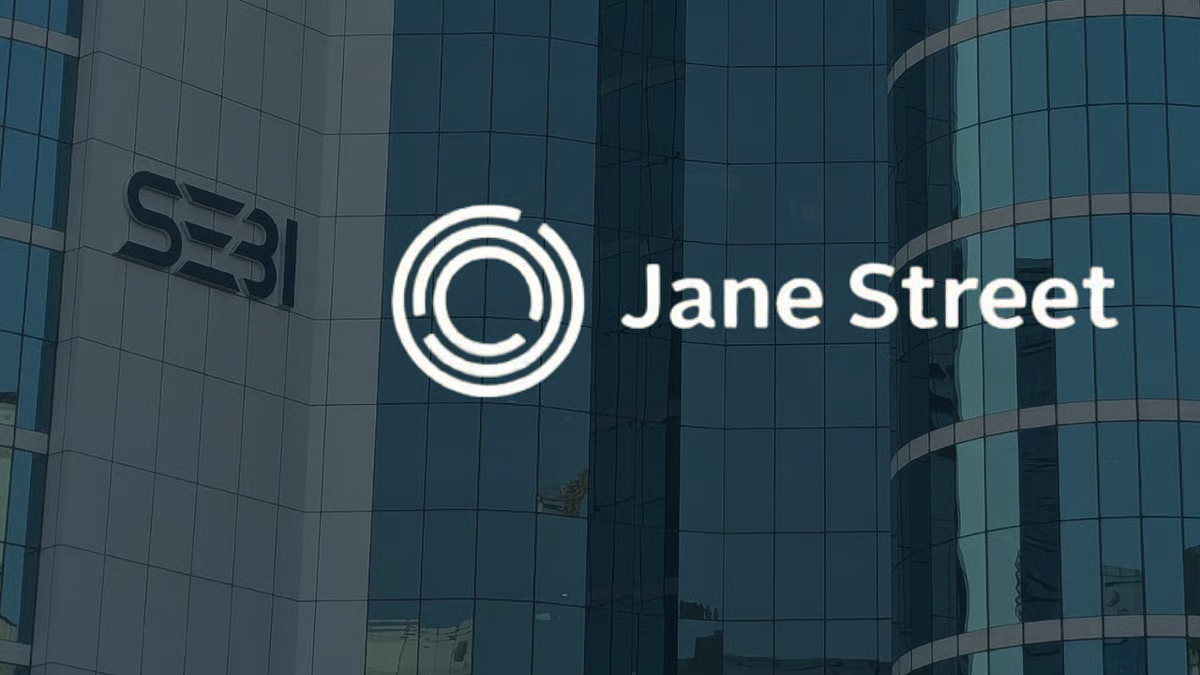
3. Regulatory Clouds & Profit Booking

  • In addition to trade worries, markets were weighed down by SEBI’s interim action against quant firm Jane Street, which dented risk appetite.
  • With benchmarks at record highs, some profit booking was inevitable amid these external uncertainties.

What Lies Ahead

July 9 Tariff Deadline

  • A deal before the deadline could reinforce investor confidence and lift the rupee—currently hovering around ₹85.39–85.40 per USD.
  • If negotiations fail, expect heightened volatility—tariff plans could significantly impact key sectors like autos, textiles, pharma, and chemicals.

Supporting Data & Reports

  • A Bloomberg Economics analysis suggests a successful deal could double India’s goods exports to the US within a decade and boost GDP by 0.6%.
  • On the flipside, lack of a deal may lead to retaliatory tariffs and dampen investor sentiment.

For Investors: Key Watchpoints

EventWhat to Monitor
India‑US trade talksProgress updates from sources in Delhi and Washington
Tariff notificationsNew US notices may escalate risk in equity and FX markets
Sector exposureAuto, textile, chemical, and pharma stocks
Volatility indicatorsRising VIX could signal increased market stress

Final Word

The week ahead is pivotal for India’s markets. The trade deal outcome by July 9 will likely set the tone. Markets may remain fragile until we have clarity. For now, traders are staying cautious, watching headlines closely, and positioning for potential upside—or downside—around the deadline.

Eqwires Research Analyst

Top-notch SEBI registered research analyst

Best SEBI registered Intraday tips provider

info@eqwires.com

Telegram Facebook Instagram

Call: +91 9624421555 / +91 9624461555

www.eqwires.com

Oil Market Outlook: Natural Gas, WTI & Brent Retreat as Traders Eye OPEC+ Decision

As global markets await a critical OPEC+ production decision, oil prices slipped amid uncertainty. Here’s an in-depth look at where natural gas, WTI crude, and Brent stand—and what lies ahead:


Natural Gas Forecast: Volatility & Consolidation

  • Sideways trading continues as markets digest mixed signals on weather and inventories.
  • A drop below $3.35/MMBtu could open the door to support in the $3.05–3.10 range, with rallies likely to be sold into.

WTI Crude Outlook: Testing Key Support

  • WTI has retreated ahead of an anticipated OPEC+ production hike of 411,000 bpd for July, with traders taking defensive positions.
  • A decisive close below $66.00 may trigger a move toward the 50-day moving average near $64.16.

Brent Crude Forecast: Breaking Below $67.50

  • Brent also saw weakness, struggling to hold above $67.50–68.00 as supply expectations weigh on prices.
  • A drop below that range could open the door to $63.50–64.00 levels.

OPEC+ Supply Watch: August Output Hike Looms

  • OPEC+ is considering a larger-than-expected output increase—possibly 550,000 bpd—at its July 6 meeting, following smaller hikes earlier this year.
  • In June, OPEC output rose by 270,000 bpd, led by Saudi Arabia and the UAE.

Broader Outlook & Price Forecasts

  • Morgan Stanley expects Brent to average near $60/bbl by early 2026, amid rising non-OPEC supply and easing geopolitical tensions.
  • S&P Global warns WTI might slip into the upper $40s later this year without stable demand.
  • Fitch notes persistent oversupply through 2025 due to OPEC+ output increases.

Key Considerations

  • Natural gas traders should watch $3.35 support; expect whipsaws.
  • Oil traders await OPEC+ next supply move—output hikes could pressure WTI and Brent.
  • Major technical support lies at $66 WTI and $67.50 Brent; breaks could lead to further downside.

What to Monitor This Week

  • July 6 OPEC+ meeting—any acceleration in supply hikes could continue weighing on crude.
  • Inventory data and U.S. economic signals could influence short-term price momentum.

Tailor your strategy with these key levels in mind:

Brent: Long near $63.50–64; stop below $67.50.

Natural gas: Buying near $3.05–3.10; trimming above $3.50.

WTI: Long near $64; stop below $66.

Eqwires Research Analyst

Top-notch SEBI registered research analyst

Best SEBI registered Intraday tips provider

info@eqwires.com

Telegram Facebook Instagram

Call: +91 9624421555 / +91 9624461555

www.eqwires.com

Nvidia Nears Unprecedented $4 Trillion Valuation—Poised to Become the World’s Most Valuable Company

Nvidia is on the brink of making financial history. On July 3, 2025, the AI-chip powerhouse briefly achieved a staggering $3.92 trillion market capitalization, surpassing Apple’s previous record of $3.915 trillion set in December 2024. Although it later closed at $3.89 trillion, the milestone puts Nvidia on track to claim the title of the most valuable company ever.


What’s Fueling Nvidia’s Surge?

  1. AI Boom and Chip Dominance
    Nvidia’s cutting-edge GPUs are powering the backbone of today’s generative AI revolution—from OpenAI and Microsoft to Alphabet and Meta—driven by soaring demand for AI data centers.
  2. Valuation Still Justifiable
    Despite nearly an eightfold rally since 2021, Nvidia trades at a price-to-earnings ratio of around 32, which is below its five-year average of 41. Analysts say this reflects strong growth visibility.
  3. Breakthrough in Robotics
    Expanding beyond chips, Nvidia is making waves in robotics. It recently unveiled AEON, a humanoid robot developed with Hexagon. Its robotics and automotive revenues are forecast to grow from $1.7 billion to $7.6 billion by the early 2030s.
  4. Path to $4 Trillion and Beyond
    Analysts predict Nvidia will hit the $4 trillion mark soon, with some bullish forecasts stretching all the way to $5 trillion within 18 months.

Market Snapshot

MetricValue
Intraday Market CapUp to $3.92 trillion
Closing Market CapApproximately $3.89 trillion
Close Price (July 3)$159.60
Intraday High$160.98
P/E RatioAbout 32
AI Revenue Forecast+350% growth through 2030

Why It Matters

  • Global Market Impact: Nvidia alone now exceeds the combined market value of Canada and Mexico, and even the entire UK equity market.
  • Pension Plan Exposure: As part of the “Magnificent Seven” tech stocks, it accounts for roughly 7% of the S&P 500. Its performance significantly moves global markets.
  • Caution Ahead: Insiders have sold over $1 billion in shares recently, though the CEO retains a large stake. This signals some profit-taking amid elevated valuations.

What’s Next?

  1. Breaking the $4 Trillion Barrier
    A modest 3% rally could push Nvidia over this historic threshold.
  2. Q3 and Q4 Play
    Historically, the third quarter sees modest gains, while the fourth quarter is Nvidia’s strongest, with average growth around 23%.
  3. Emerging Competition
    Investors should watch for regulatory shifts in U.S.–China trade and new chip alternatives from competitors. Both could introduce volatility.

Bottom Line

Nvidia’s race toward a record-breaking valuation is a global signal of the AI era’s momentum. Its dominance in chips, emerging robotics business, and growing market presence underscore its potential, but investors should remain alert to competition, insider selling, and evolving geopolitical risks.

Eqwires Research Analyst

Top-notch SEBI registered research analyst

Best SEBI registered Intraday tips provider

info@eqwires.com

Telegram Facebook Instagram

Call: +91 9624421555 / +91 9624461555

www.eqwires.com

🚨 SEBI Cracks Down on Jane Street: ₹4,843 Crore Unlawful Gains Impounded in Major Market Manipulation Case

India’s capital markets regulator, the Securities and Exchange Board of India (SEBI), has taken one of its strongest enforcement actions yet by impounding ₹4,843 crore in alleged unlawful gains from Jane Street, the U.S.-based quantitative trading giant. This dramatic move has sent ripples across India’s derivatives markets and raised concerns about the integrity of index trading strategies.


📌 What Happened?

According to SEBI’s 111-page order, Jane Street India Trading Pvt Ltd and related entities engaged in a “manipulative scheme” to artificially influence Bank Nifty index expiry prices. The strategy involved:

  • Aggressive buying of Bank Nifty futures and large-cap banking stocks in the morning to drive the index higher.
  • Simultaneously holding large short positions in Bank Nifty options, set to profit if the index dropped by expiry.
  • Liquidating the futures positions in the afternoon, creating a predictable pattern of intraday volatility.
  • Using coordinated mirror trades among group companies to create the illusion of genuine market activity.

SEBI described this as a “fraudulent device” that systematically distorted fair price discovery.


💰 The Scale of the Gains

Between January 2023 and March 2025, Jane Street’s operations in India reportedly generated:

  • Total gains: ~₹36,500 crore across all segments.
  • Netting losses elsewhere: ~₹7,600 crore.
  • Unlawful gains identified: ₹4,843.57 crore attributable to the manipulative pattern.

SEBI ordered the impounding of these profits pending adjudication.


🛑 What Actions Has SEBI Taken?

1. Freezing Funds & Assets

  • All accounts (trading, demat, bank) frozen up to the impounded amount.
  • The funds have to be placed in an escrow account within 15 days.

2. Trading Ban

  • Jane Street India and affiliates are barred from accessing Indian securities markets until further notice.

3. Mandatory Disclosure

  • The firms must file a complete statement of assets within India to SEBI.

This is one of the largest enforcement actions against a foreign financial institution in Indian market history.


📉 Why Does It Matter?

Jane Street is one of the world’s biggest algorithmic trading firms, known for market-making and statistical arbitrage. The case underscores:

  • Regulatory Vigilance: India’s markets are maturing rapidly, and SEBI is showing zero tolerance for strategies that cross ethical lines.
  • Investor Protection: Manipulative expiry-day tactics hurt smaller investors and undermine confidence in derivatives.
  • Global Signal: The order puts other foreign funds on notice about Indian compliance expectations.

💬 Jane Street’s Response

The firm has disputed SEBI’s findings, saying it complies with regulations globally and intends to defend itself through due process. Jane Street has 21 days to file a response.


🔍 What Happens Next?

  • If the order is upheld after adjudication, the impounded gains could be permanently confiscated.
  • SEBI’s investigation could expand into similar expiry-related strategies by other institutions.
  • Market participants expect short-term volatility in Bank Nifty and index options volumes as traders adjust.

✅ Final Thoughts

This is a watershed moment for India’s market oversight. SEBI has drawn a clear line: Aggressive algorithmic trading is fine—but crossing into manipulation will trigger the strictest penalties.

Stay tuned for updates as the legal process unfolds.

Eqwires Research Analyst

Top-notch SEBI registered research analyst

Best SEBI registered Intraday tips provider

info@eqwires.com

Telegram Facebook Instagram

Call: +91 9624421555 / +91 9624461555

www.eqwires.com

🚀 Bandhan Bank, Bank of Baroda, AU SFB, Bajaj Finance: What Analysts Say After Q1 Updates

India’s leading lenders and NBFCs have announced their Q1 business updates, providing crucial insights into how growth, margins, and deposit mobilization are shaping up in FY26. Let’s take a detailed look at what analysts are saying about Bandhan Bank, Bank of Baroda, AU Small Finance Bank, and Bajaj Finance after their latest numbers.


🏦 Bandhan Bank: CASA Under Pressure, Growth Slows

Key Highlights:

  • CASA ratio fell sharply to 27.06% vs. 33.4% YoY and 31.4% QoQ.
  • Low-cost deposits declined by 5.8% YoY and 11.8% sequentially.
  • Loans and advances grew just 6.4% YoY, but actually contracted 2.5% QoQ to ₹1.34 lakh crore.
  • Net profit dropped ~19% YoY to ₹721 crore.

Analyst View:
Nomura downgraded the stock to Neutral, citing:

“Weak deposit and loan growth, margin pressure, and soft fee income remain key concerns.”

Investor Takeaway:
Watch if Bandhan can rebuild its low-cost deposit base and regain growth momentum.


💼 Bank of Baroda: Solid Retail Gains, Margin Concerns

Q1 Snapshot:

  • Total business up 11% YoY to ₹26.4 lakh crore.
  • Domestic retail advances rose ~17%, deposits grew ~8%.
  • Treasury gains partially cushioned margin softness.

Analyst Rating:
Nomura retained a Neutral stance due to margin pressure but noted healthy business growth.

Investor Takeaway:
Expect stable operations with moderate growth; monitor treasury and core fee income trends.


🌟 AU Small Finance Bank: Strong Growth Continues

Performance Highlights:

  • Gross advances rose 23.1% YoY, 2.6% QoQ.
  • Deposits grew 31.3% YoY, 2.8% QoQ.
  • CASA ratio remained robust; CD ratio at ~87.4%.

Analyst Commentary:
Motilal Oswal Financial Services (MOFSL) maintained a Buy rating:

“Healthy growth in advances and deposits demonstrates the bank’s execution strength.”

Investor Takeaway:
AU SFB remains a high-growth play among small finance banks.


💹 Bajaj Finance: Strong AUM and Customer Acquisition

Business Update:

  • AUM grew 25% YoY to ₹4.41 lakh crore.
  • New loans booked jumped 23% YoY to 13.49 million.
  • Deposit book rose 15% YoY to ₹72,100 crore.

Analyst Consensus:
Most brokerages maintained a Buy rating with ~₹915 target, citing consistent execution and growth visibility.

Investor Takeaway:
Bajaj Finance continues to outperform peers, though valuations remain elevated.


🔍 Quick Comparison Table

CompanyQ1 HighlightsAnalyst View
Bandhan BankCASA decline, weak growthNeutral (Nomura)
Bank of BarodaRetail growth, margins under pressureNeutral (Nomura)
AU SFBRobust advances and depositsBuy (MOFSL)
Bajaj FinanceStrong AUM and loan growthBuy (Consensus)

Summary for Investors
These updates underline how deposit costs and lending growth are diverging across banks and NBFCs. While AU SFB and Bajaj Finance are sustaining momentum, Bandhan faces near-term challenges, and Bank of Baroda remains steady with moderate growth.

Eqwires Research Analyst

Top-notch SEBI registered research analyst

Best SEBI registered Intraday tips provider

info@eqwires.com

Telegram Facebook Instagram

Call: +91 9624421555 / +91 9624461555

www.eqwires.com